

Quadratic Fit
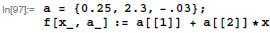
Here is a definition of a linear function f :
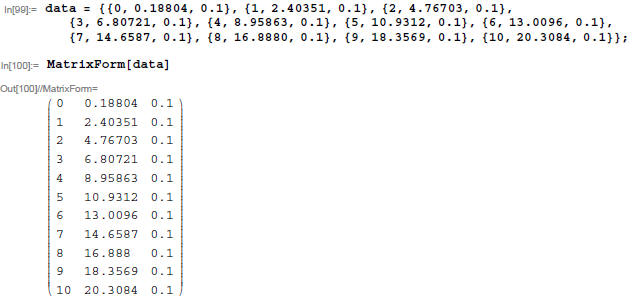
Now generate a data set in list named "data."
The "x" values are in data[[i,1]] (column 1 below), the "measured" y values are
in data[[i,2]] (column 2 below), and the uncertainties
in the y values are in data[[i,3]] (column 3 below).
Convert one of the next three cells from "text" format to "input" format to fill
the list named "data." The first cell generates a data
set based on a quadratic function with random noise; the second cell imports the
data from a file named "sample.dat"; the third
uses the sample data from from the writeup.
data = Table[{x = i,f[x,a]-0.3 x^2
+Random[NormalDistribution[0,.1]],.1},{i,0,10}];
data=Import["sample.dat"]
Separate the list "data" into a list that has x-y pairs
only ("xydata"), and a list that has the weights for each point ("w"). This is
convenient for the Mathematica syntax in the function Regress below.

Export["example3.dat",testdata]; (* Export data for
gnuplot comparison if desired *)
Define functions that calculate x2 . The function x2
includes weights; the function x2 nw doesn't.

 Minimize x2
with weighted LINEAR fitting
Minimize x2
with weighted LINEAR fitting
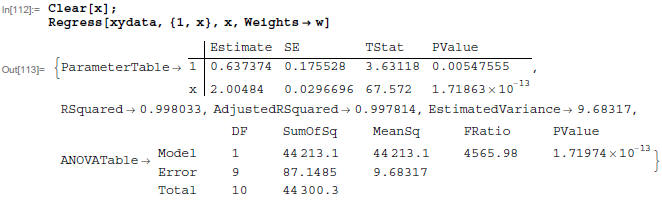
You can get other specific information in the
RegressionReport that is the output of the Regress function. Note that the
Covariance-
Matrix of Mathematica is the curvature matrix, α , TIMES the reduced x2
of the original data set.. (See my notes and
error_test.nb)

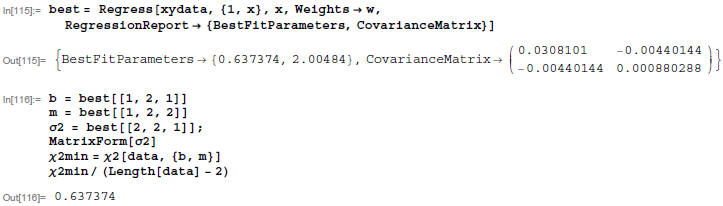
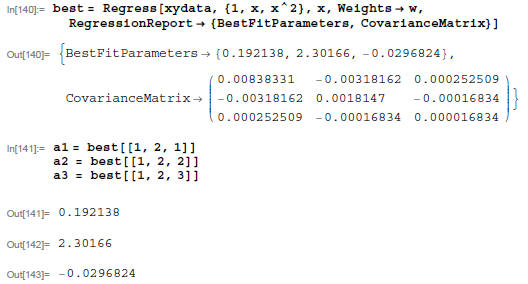
To use information from RegressionReport, I give the rules
returned in the RegressionReport a name, and then I given pick out the
individual information:
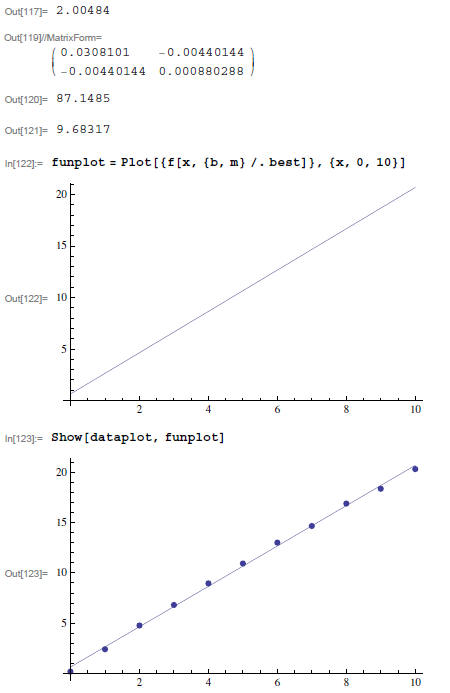
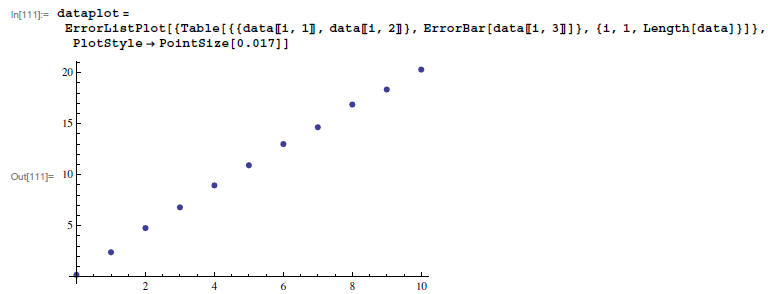
This plot looks linear, but the value of the reduced x2 is pretty high. Let's plot residuals:
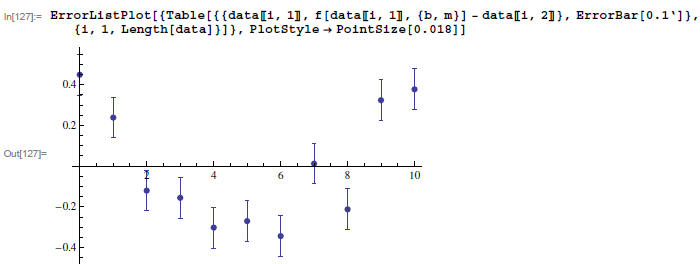
This suggests that there a quadratic term might be a good
thing in our fitting function.
![]() Redo with weighted
QUADRATIC fitting
Redo with weighted
QUADRATIC fitting
Add a term to the function f to make it a quadratic:
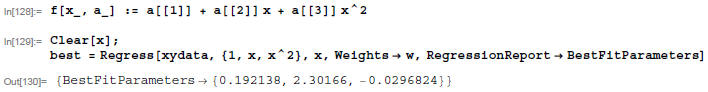
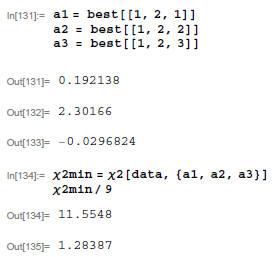
To use information from Report:
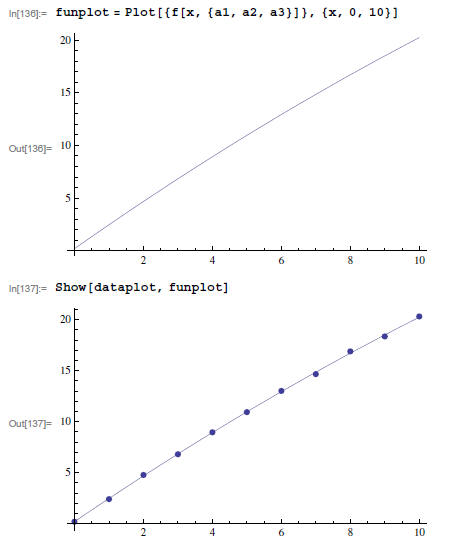
Plot residuals:
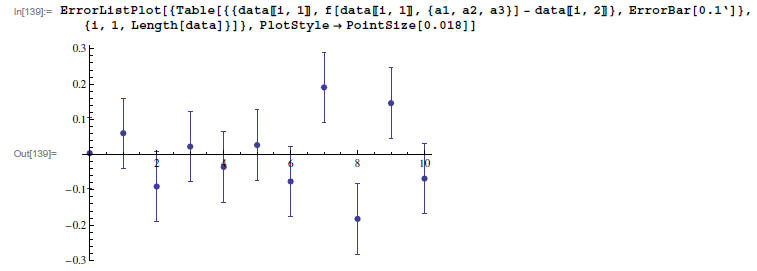
MUCH BETTER!
![]() Using Calibration
Using Calibration
Assume that you measure some value of y, and call this value Y, with uncertainty ΔY.
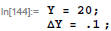
The following gives the best X (you could use quadratic formula to find X in this case):
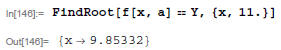
![]() Generate hypothetical data sets
Generate hypothetical data sets
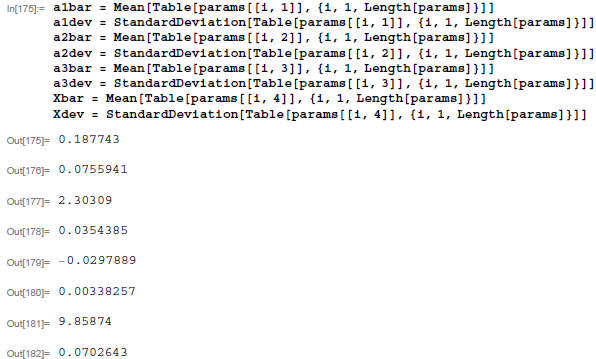
NOTE: The final uncertainty Xdev is due to uncertainty in
parameters and uncertainty Δ Y. You can check relative contributions
by fixing hY = Y and recalculating to give uncertainty due to parameters, and
using linear approx to get uncertainty due to Δ Y:
(Δ X)_{parameter unnertainty} = 0.041
(Δ X)_{Y uncertainty} = Δ Y/(local slope) = .1/(2.3 - .06 \times X) = 1.71 =
0.058
(Δ X)_total = Sqrt[.0041^2 + 0.058^2] = 0.071